Hello there!

Need Help? We are right here!

miniOrange Email Support
success

Thanks for your Enquiry.

If you don't hear from us within 24 hours, please feel free to send a follow-up email to info@xecurify.com

Search Results:

×

Admin and Audit Dashboard


Upon successful login as an admin, you will be presented with two dashboards: the Admin Dashboard and the Audit Dashboard. By default, upon logging in, you will be directed to the Admin Dashboard.

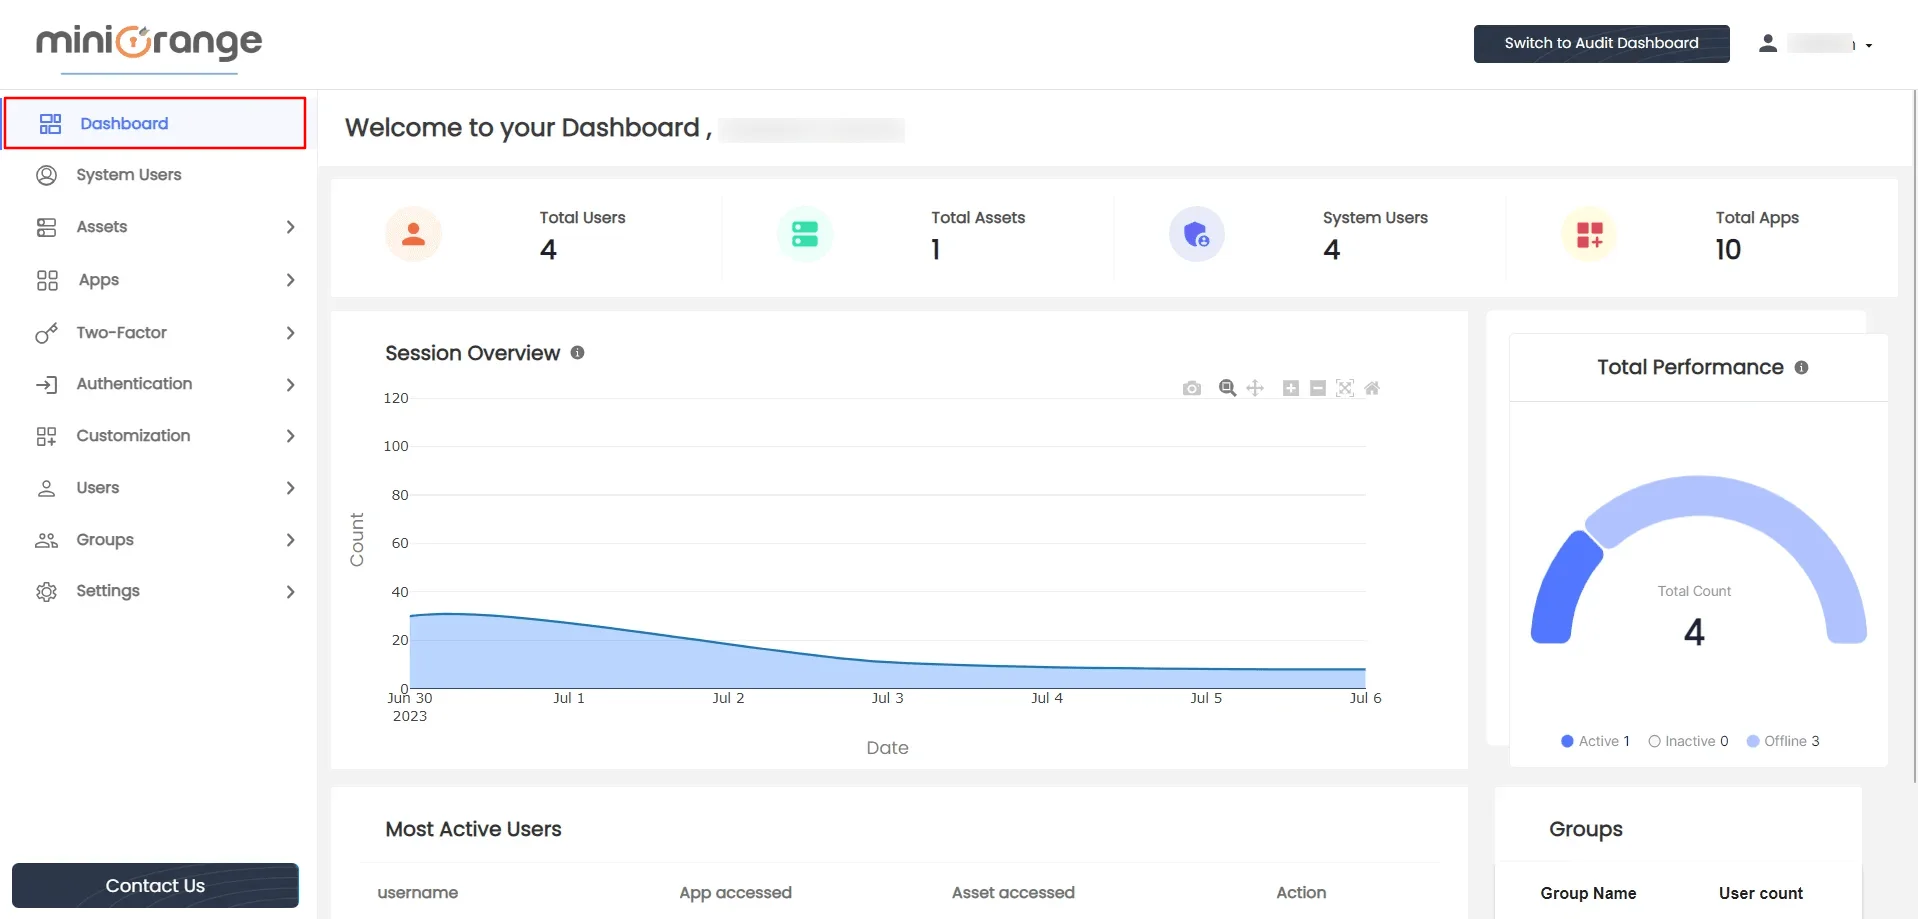
Admin dashboard Home Page -

  • At the top of the page, a welcome message is displayed, which includes the Username of the logged-in admin. After the welcome message, there are entity counts such as Total Users, Total Assets, System Users, and Total Apps.
  • PAM Admin Handbook: Overview

  • The main body of the home page consists of four distinct sections
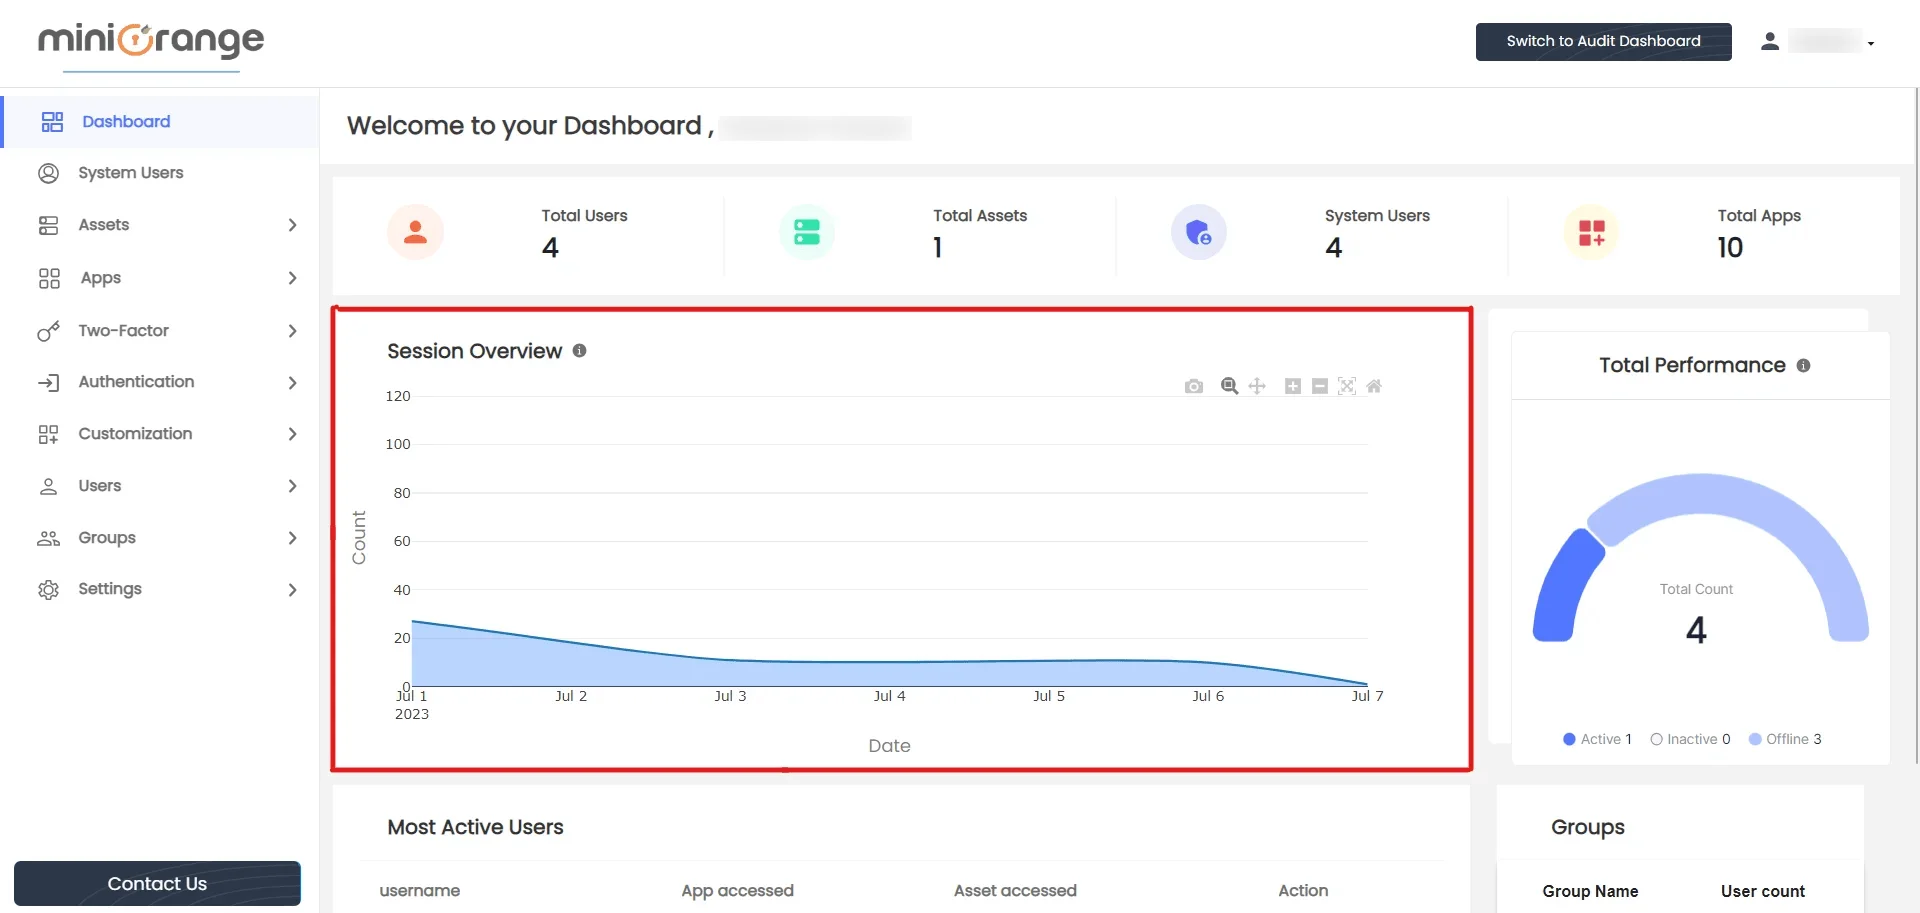
    • Session Overview -
      This section presents a graph displaying the data on the number of successful logins made each day, providing an overview of login activity over time.
    • PAM Admin Handbook: Sessions Overview

    • Total Performance -
      This section features a doughnut chart divided into three sections: Active Users (representing the number of users currently logged in), Inactive Users (representing the number of users with locked accounts), and Offline Users (representing the number of users who are currently not logged in). The chart gives an overview of user activity and status.
    • PAM Admin Handbook: Performance

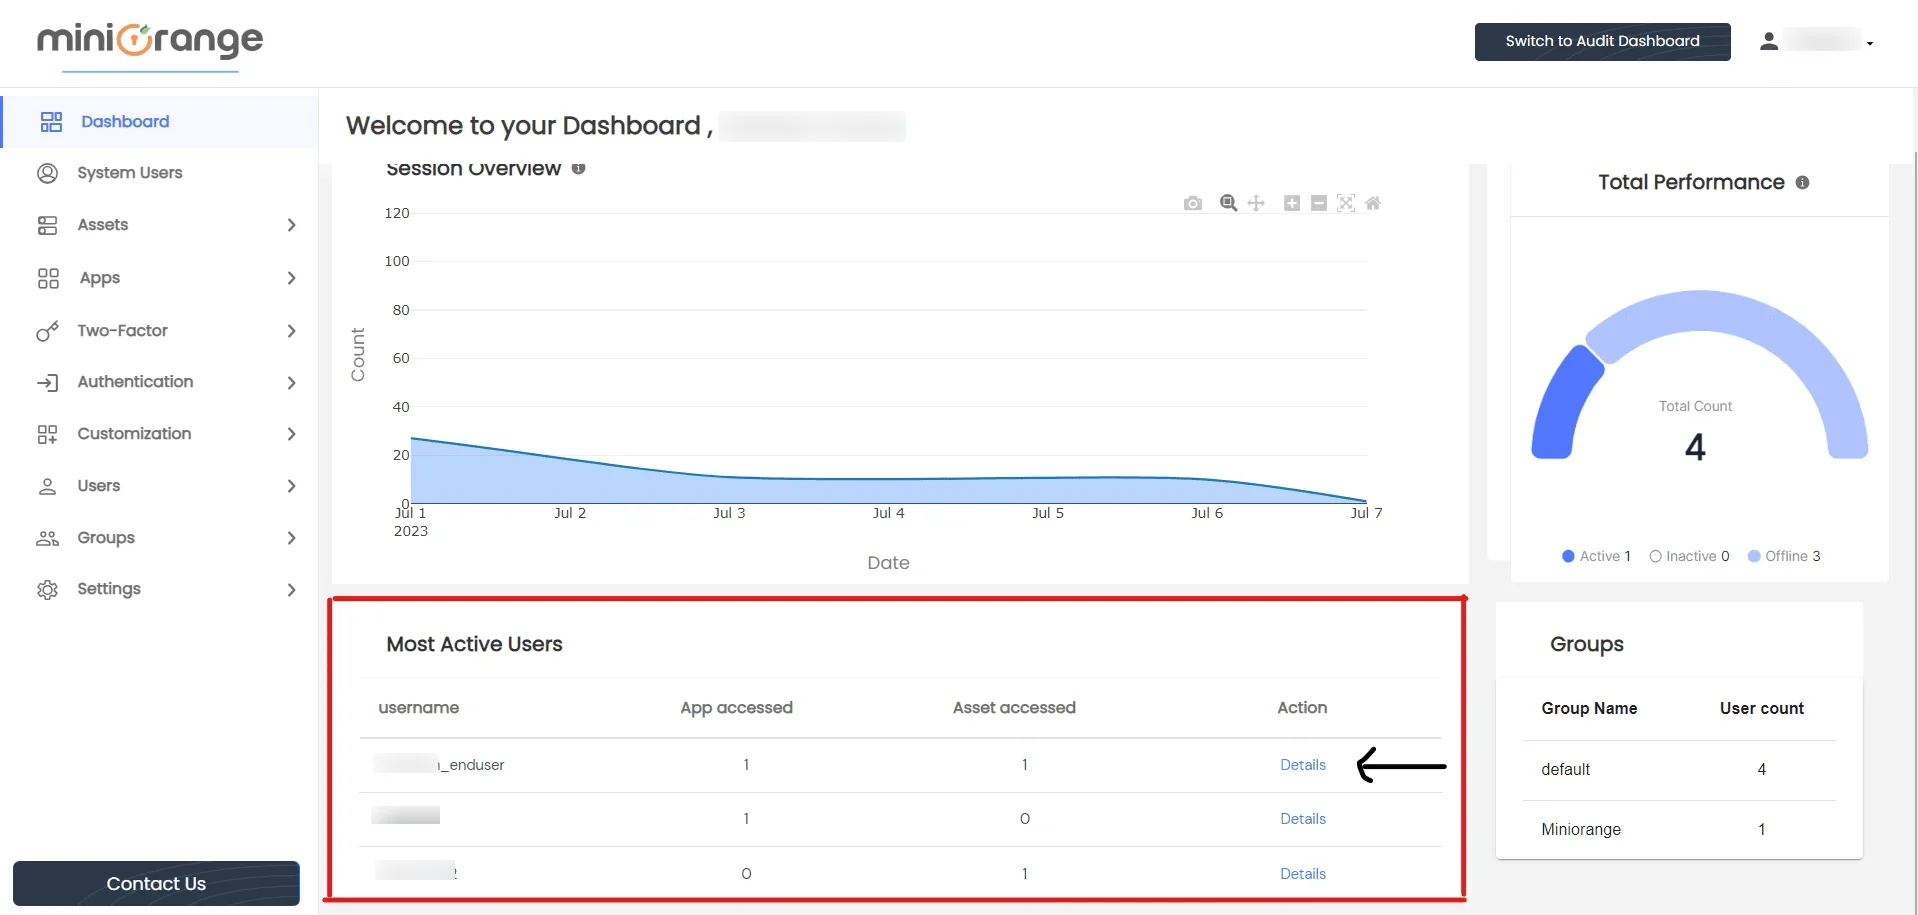
    • Most Active Users -
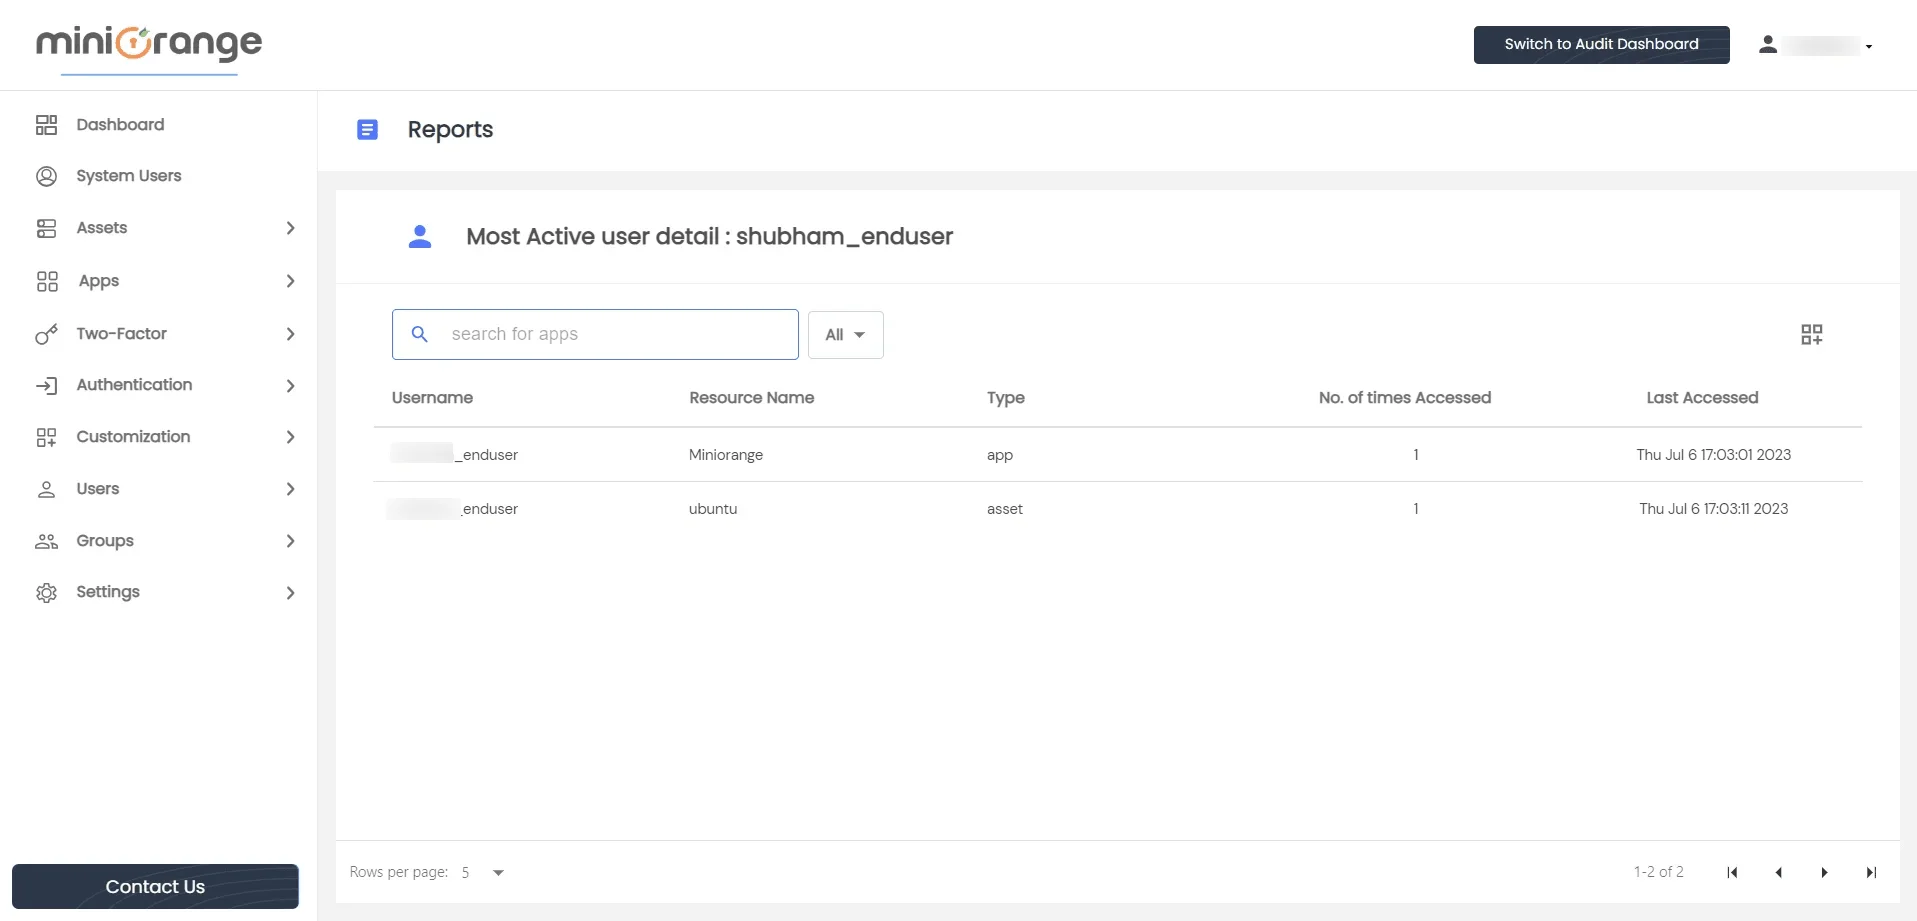
      This section contains a datatable listing the top three users who have accessed the highest number of resources (apps/assets) within the last 24 hours. Each row in the table provides an option to view details, redirecting you to a page with specific data for that user, such as the name of the accessed resource, the number of times it was accessed, and the timestamp of the last access.
    • PAM Admin Handbook: Users Details

      PAM Admin Handbook: Most Active Users

    • Groups -
      This section displays a list of the three most recently created groups, providing a quick overview of the latest group creations.
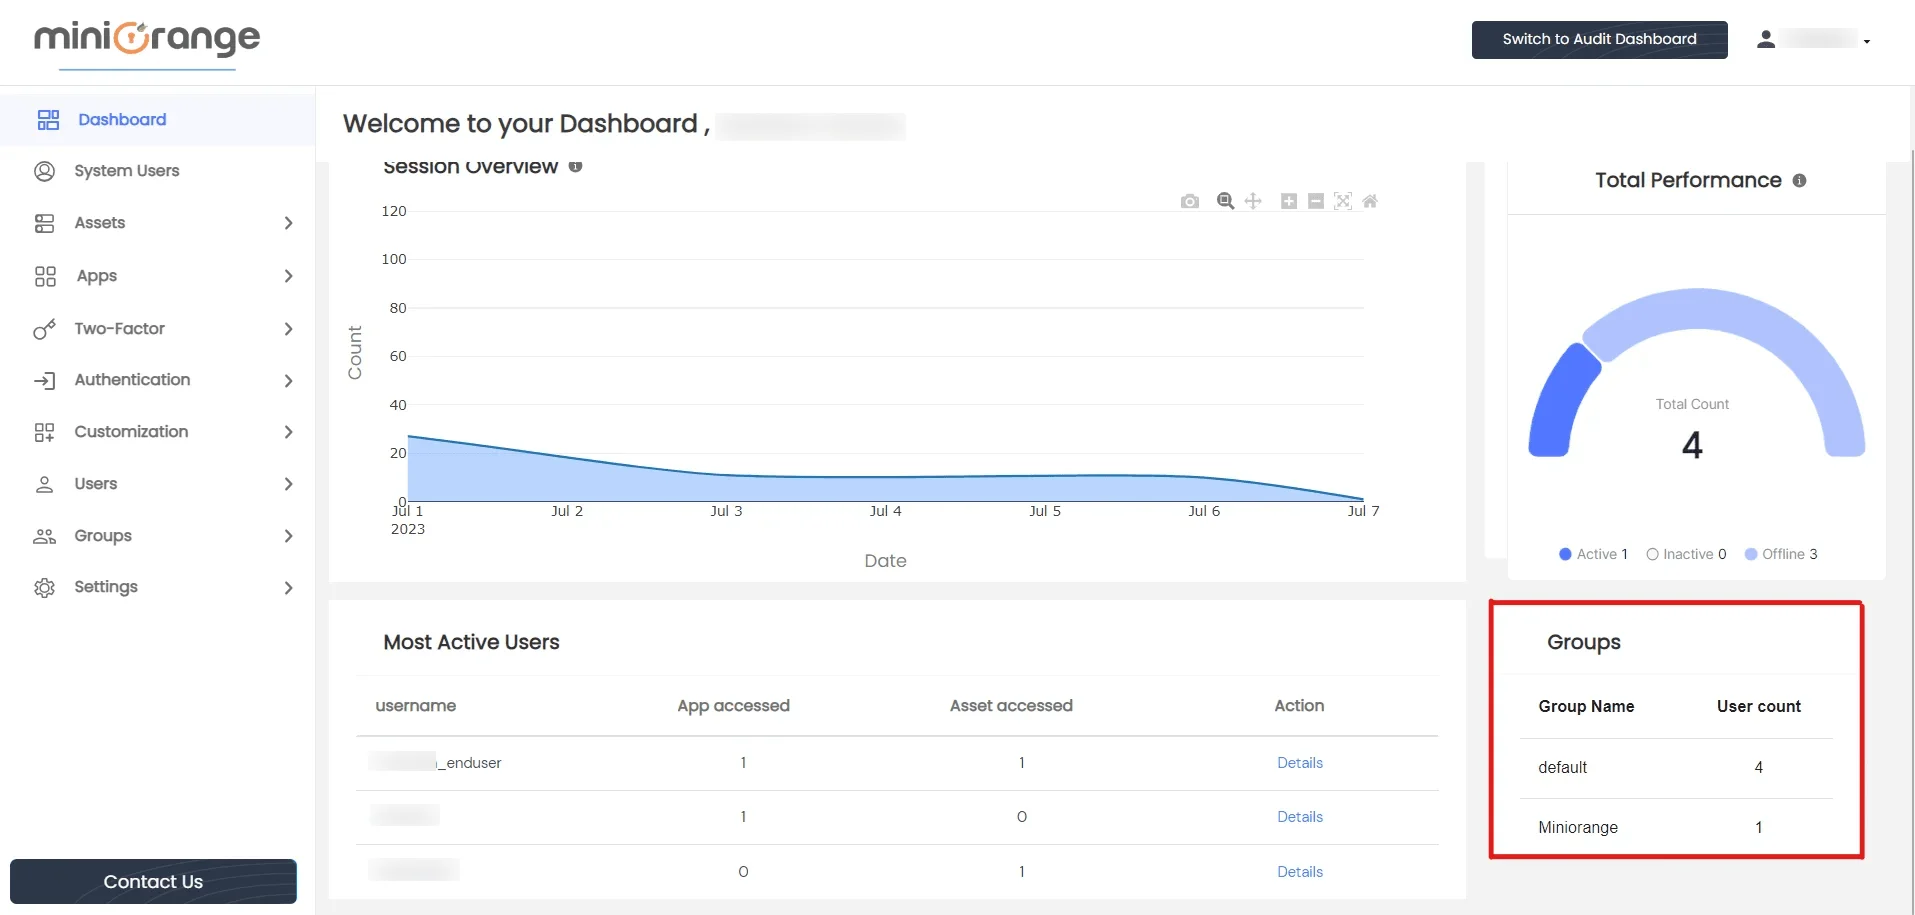
    • PAM Admin Handbook: Graph

  • Upon selecting the "Switch to Audit Dashboard" option located on the right side of the navigation bar, you will be redirected to the Audit Dashboard.
  • PAM Admin Handbook: Switch to Audit Dashboard

Audit dashboard Home Page -

  • At the top of the page, a welcome message is displayed, including the username of the logged-in admin. Following the welcome message, there are entity counts such as Active Users (count of logged-in users), Active Sessions (total tabs opened), and Recordings Made (count of captured recordings until now).
  • PAM Admin Handbook: Overview

  • The main body of the home page consists of four distinct sections
    • Apps-Asset Overview -This section features a bar graph illustrating the number of apps and assets accessed within the last seven days. It provides an overview of app and asset usage and activity over time.
    • PAM Admin Handbook: App-Asset Overview

    • Executed commands - This section features a doughnut chart divided into two sections: Successful Commands (representing the number of commands executed successfully) and Failed Commands (representing the number of commands that failed to execute).
    • PAM Admin Handbook: Executed Commands

    • Top 3 Most Accessed Resources - This section consists of a datatable listing the three resources (apps/assets) that have been accessed the most. It highlights the most frequently utilized resources based on user activity
    • PAM Admin Handbook: Top 3 Most Accessed Resources

    • Login Success/Failure - This section features a doughnut chart divided into two sections: Successful logins (representing the number of logins made successfully) and Failed logins (representing the number of login attempts that failed)
    • PAM Admin Handbook: Login Success/Failure